The following map shows the percentage of Asian people by county, as determined by the 2000 Census survey. Several trends are apparent in this graph. Major metropolitan areas appear to have the densest Asian population, especially those in coastal areas. The San Francisco Bay area has the highest population of Asians in the country.

The next map shows the percentage of Black people by county, also from 2000 Census data. An obvious trend is the high black population of the southern U.S. Some counties in this region have over 80% black people. Some counties with large area in the western U.S. have a somewhat high black population, but it would be interesting to see how this map would change if these large counties were divided into smaller areas. This would increase understanding of the distribution of blacks in the western U.S.

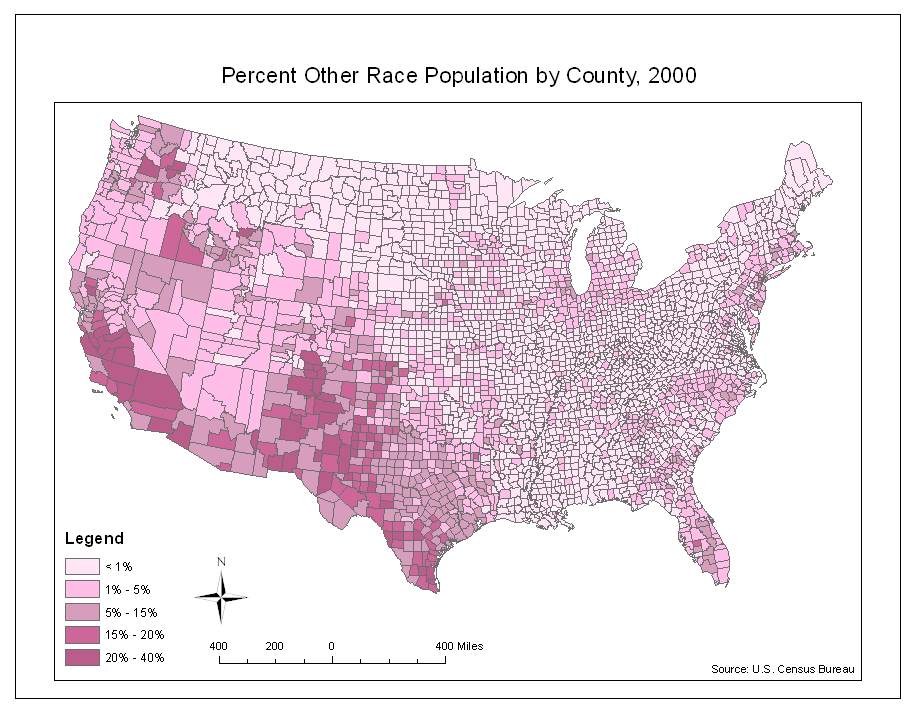
This map shows the percentage of people of some other race by county, also determined by the 2000 Census. These people could be any race not listed on a Census form. Races listed on the 2000 Census forms are: White, Black, Asian, American Indian, Alaska Native, Pacific Islander, and Native Hawaiian. People can choose "some other race" on their Census form if they think they fall into another category. This map shows that the highest concentration of people of other races is found in the Western United States: California, New Mexico, Texas, Washington, and Arizona. This may be because these areas have a high Hispanic population, and Hispanic is not a racial option on Census forms. Although information about Hispanic descent can be provided as part of a different question, some people choose to write it in under the "other race" category.
Creating maps like these three from raw Census data is very important because people trained to use GIS can take an extremely long list of numbers, which would probably be uninterpretable to most people and turn it into a map that can be easily read and interpreted. The data is then more accessible and can be used for many different applications. In creating these Census maps, I paid careful attention to the cartographical technicalities such as color and creation of breaks. With improper use of color and numbers, the map becomes less useful and doesn't serve its intended purpose.
I found ArcGIS to be fun to use. Each week in lab, I looked forward to seeing what function we would learn to do in ArcGis. There are so many different potential uses of the program and I feel like this class only explored a few of them.