This image shows how the size of the Station Fire changed dramatically from August 29 to September 2, 2009.

This graph tracks how the acreage of the fire increased from August 29th to September 2nd.

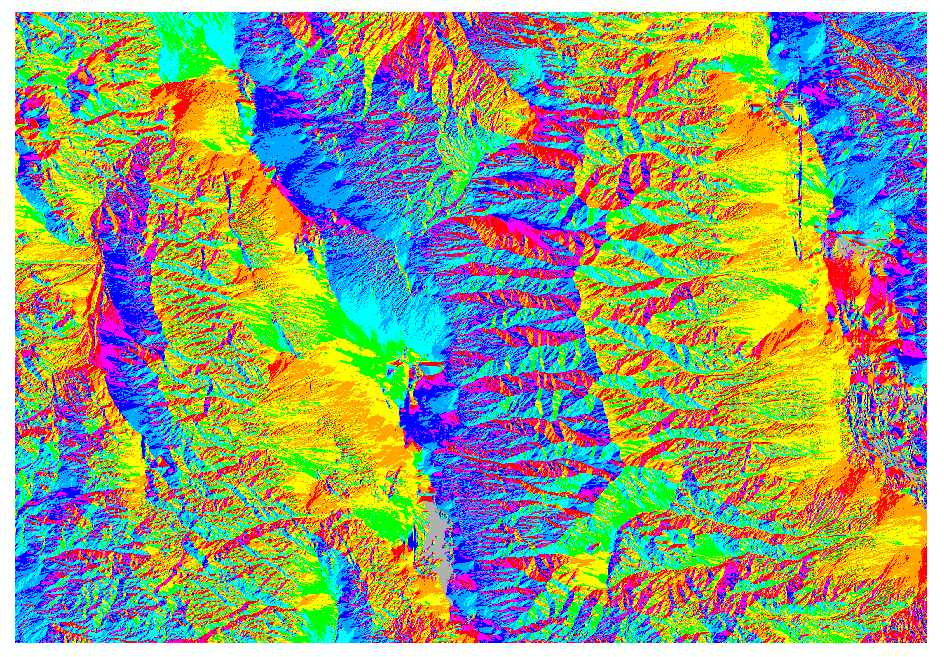
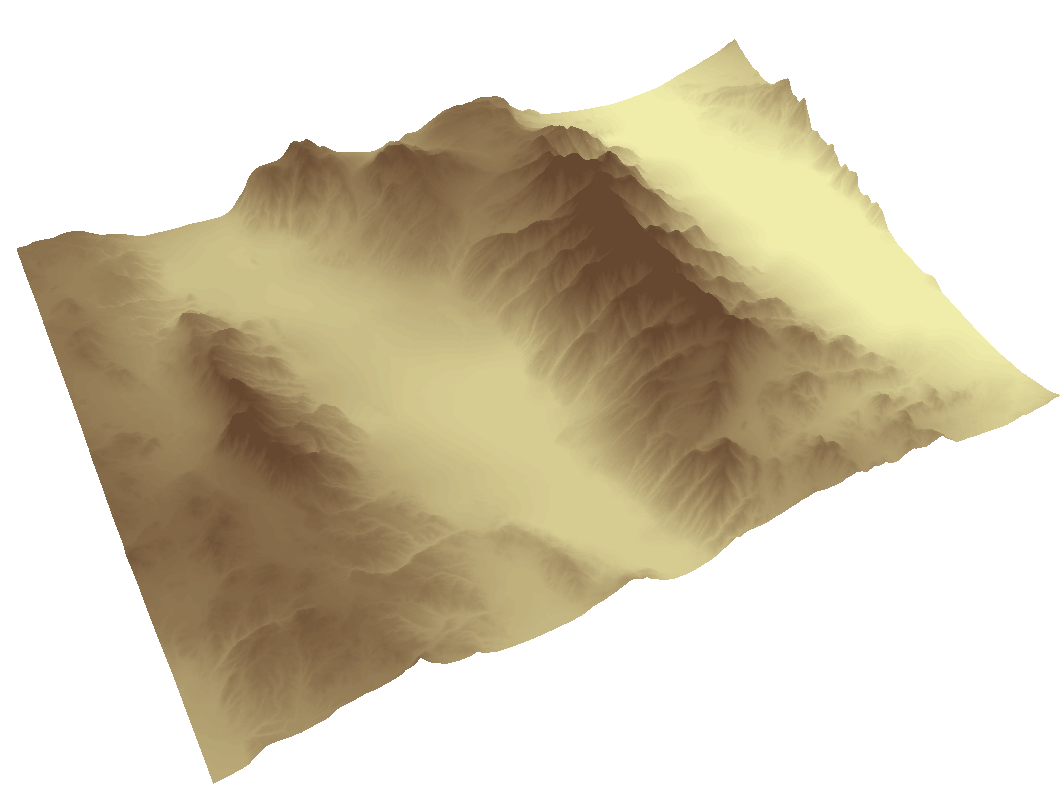
The spread of the wildfire was intensified due to the extremely mountainous terrain. Almost every part of the affected area had a slope of over 80%, as shown by the following image.

The Station Fire was the largest fire ever recorded in the Angeles National Forest and the 10th largest fire recorded in California since 1933 (InciWeb 2009). started on August 26th, 2009 and burned more than 250 square miles in the San Gabriel Mountains, and was not fully contained until October 16th, 2009 (Inciweb 2009). Fire experts determined that the fire was most likely started by arson, and caused the deaths of two firefighters and the injury of 22 people (InciWeb 2009). Fire personnel were blamed for not controlling the fire more effectively when it was first lit (KPCC Wire Services 2010).
The three things needed for fire to burn are oxygen, fire, and fuel (SmokeyBear.com 2010). The Station Fire was fueled by fallen pine needles and branches and living pine trees of the Angeles National Forest (InciWeb 2009). Fuel is abundant in California due to the region's steep terrain and rainfall patterns: more rain falls in the spring and increases vegetation growth, but summer brings heat and dryness and much of the spring growth dies and becomes dry and very flammable (Wikipedia 2010). When no fire has burned out an area for many years, fuel builds up and makes it very easy for a fire to spread out of control even if winds are not strong (Wikipedia 2010).
Although it burned largely in the Angeles National Forest, where population density is low, the Station Fire still did a lot of damage to residential and commercial areas. By August 30th, it had already destroyed 18 homes, many deep in the forest, and posed a significant threat to 10,000 more homes, 500 business structures, and 2,000 other buildings (CBS News 2009). One such building threatened by the Station Fire was the Mount Wilson Observatory, where there are many telescopes and 22 communications towers (Lakdawalla 2009). Two firefighters were killed as they tried to escape the flames and their truck drove off a cliff (CBS News 2009). The fire grew dramatically quickly, especially to the north, and was not even encouraged by Santa Ana winds (CBS News 2009).
In addition to the injury, death, and destruction, the Station Fire had many other ill effects. It made air quality intolerable in the surrounding communities of La Cañada Flintridge, Altadena, La Crescenta, and Pasadena (Lakdawalla 2009). Mudslides can occur after fires wipe out the vegetation that normally keeps the soil in place. The rains that follow can loosen soil enough to create massive mudslides that can rip homes from their foundation, so residents of areas affected by the Station Fire worked hard to create barriers that would protect their homes from mudslides (Zavis 2009). The San Gabriel Mountains are particularly susceptible to mudslides because they are made up of brittle, crumbly rocks (Zavis 2009). A mudslide ended up destroying over 40 homes in La Canada Flintridge (KPCC Wire Services 2010).
Although fires like this one are very destructive, they play an important role in maintaining the balance of ecosystems. The number of wildfires in Southern California has increased due to human influence, but periodic natural burning has many benefits. Fire removes excessive plant growth and makes room for new plants to grow (Long 2009). Fires also release nutrients into the soil, encouraging the growth of new plants (Long 2009). Fire experts are working to rehabilitate the area burned by the Station Fire (InciWeb 2009).
References:
Author, A. A., & Author, B. B. (Date of publication). Title of document. Retrieved from http://Web address
CBS2 News. (30 August 2009). 2 Firefighters Killed As Station Fire Grows. Retrieved from http://cbs2.com/local/Fire.Watch.Angeles.2.1152524.html
InciWeb: the Incident Information System. (10 November 2009). Station Fire. Retrieved from http://www.inciweb.org/incident/1856/
Knoll, Corina & Zavis, Alexandra. (17 September 2009). After the Station fire, a new danger: mudslides. Retrieved from http://articles.latimes.com/2009/sep/17/local/me-sandbags17
KPCC Wire Services. (6 February 2010). Evacuation orders lifted for mudslide residents as clean-up effort gets underway. Retrieved from http://www.scpr.org/news/2010/02/06/heavy-rains-trigger-mudslides-station-burn-areas/
Lakdawalla, Emily. (31 August 2009). Station Fire update: Mount Wilson Observatory still there, but still under threat. Retrieved from http://www.planetary.org/blog/article/00002074/
Long, Alan J. (2009). Benefits of Prescribed Burning. Retrieved from http://edis.ifas.ufl.edu/fr061
Wikipedia, the free encyclopedia. (27 May 2010). 2009 California Wildfires. Retrieved from http://en.wikipedia.org/wiki/2009_California_wildfires